
It is commonly heard today that small farmers produce most of the world's food. But how many of us realise that they are doing this with less than a quarter of the world's farmland, and that even this meagre share is shrinking fast? If small farmers continue to lose the very basis of their existence, the world will lose its capacity to feed itself.
GRAIN took an in depth look at the data to see what is going on and the message is crystal clear. We need to urgently put land back in the hands of small farmers and make the struggle for agrarian reform central to the fight for better food systems.
Download the PDF version of this report here
Download the printer friendly dataset in PDF format here.
Download the fully-referenced dataset as a spreadsheet here.

Alcides Raméon Ramírez, a member of one of 200 peasant families fighting to defend their land in Curuguaty, Paraguay. Eighty percent of the country's land is in the hands of just two percent of landowners. (Photo: Pablo Tosco/Oxfam Intermon)
Governments and international agencies frequently boast that small farmers control the largest share of the world's agricultural land. Inaugurating 2014 as the International Year of Family Farming, José Graziano da Silva, Director General of the United Nations Food and Agriculture Organisation (FAO), sang the praises of family farmers but didn't once mention the need for land reform. Instead he stated that family farms already manage most of the world's farmland1 – a whopping 70%, according to his team.2 Another report published by various UN agencies in 2008 concluded that small farms occupy 60% of all arable land worldwide.3 Other studies have come to similar conclusions.4
But if most of the world's farmland is in small farmers' hands, then why are so many of their organisations clamouring for land redistribution and agrarian reform? Because rural peoples' access to land is under attack everywhere. From Honduras to Kenya and from Palestine to the Philippines, people are being dislodged from their farms and villages. Those who resist are being jailed or killed. Widespread agrarian strikes in Colombia, protests by community leaders in Madagascar, nationwide marches by landless folk in India, occupations in Andalusia – the list of actions and struggles goes on and on. The bottom line is that land is becoming more and more concentrated in the hands of the rich and powerful, not that small farmers are doing well.
Rural people don't simply make a living off the land, after all. Their land and territories are the backbone of their identities, their cultural landscape and their source of well-being. Yet land is being taken away from them and concentrated in fewer and fewer hands at an alarming pace.
Then there is the other part of the picture: that concerning food. While it is now increasingly common to hear that small farmers produce the majority of the world's food, even if that is outside of market systems, we are also constantly being fed the message that the "more efficient" industrial food system is needed to feed the world. At the same time, we are told that 80% of the world's hungry people live in rural areas, many of them farmers or landless farmworkers.
How do we make sense of all this? What is true and what is not? What action do we take to deal with these imbalances? To help answer some of these questions, GRAIN decided to take a closer look at the facts.5 We tried to find out how much land is really in the hands of small farmers, and how much food they produce on that land.6
The figures and what they tell us
When we looked at the data, we came across quite a number of difficulties. Countries define "small farmer" differently. There are no centralised statistics on who has what land. There are no databases recording how much food comes from where. And different sources give widely varying figures for the amount of agricultural land available in each country.
In compiling the figures, we used official statistics from national agricultural census bureaus in each country wherever possible, complemented by FAOSTAT (FAO's statistical database) and other FAO sources where necessary. For statistical guidance on what a "small farm" is, we generally used the definition provided by each national authority, since the conditions of small farms in different countries and regions can vary widely. Where national definitions were not available, we used the World Bank's criteria.
In light of this, there are important limitations to the data – and our compilation and assessment of them. (See Annex 1 for a fuller discussion of the data.) The dataset that we produced is fully referenced and publicly available online and forms an integral part of this report.7
Despite the inherent shortcomings of the data, we feel confident in drawing six major conclusions:
- The vast majority of farms in the world today are small and getting smaller
- Small farms are currently squeezed onto less than a quarter of the world's farmland
- We are fast losing farms and farmers in many places, while big farms are getting bigger
- Small farms continue to be the major food producers in the world
- Small farms are overall more productive than big farms
- Most small farmers are women
Many of these conclusions might seem obvious, but two things shocked us.
One was to see the extent of land concentration today, a problem that agrarian reform programmes of the 20th century were supposed to have solved. What we see happening in many countries right now is a kind of reverse agrarian reform, whether it's through corporate land grabbing in Africa, the recent agribusiness-driven coup d'état in Paraguay, the massive expansion of soybean plantations in Latin America, the opening up of Burma to foreign investors, or the extension of the European Union and its agricultural model eastward. In all of these processes, control over land is being usurped from small producers and their families, with elites and corporate powers pushing people onto smaller and smaller land holdings, or off the land entirely into camps or cities.
The other shock was to learn that, today, small farms have less than a quarter of the world's agricultural land – or less than a fifth if one excludes China and India from the calculation. Such farms are getting smaller all the time, and if this trend persists they might not be able to continue to feed the world.
Let's go through these findings point by point.
1. The vast majority of farms in the world today are small and getting smaller
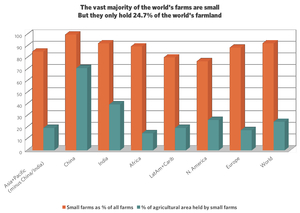
By our calculations, over 90% of all farms worldwide are "small", holding on average 2.2 hectares (Table 1). Even if we exclude China and India – where about half of the world's small farms are located – from the calculations, small farms still account for over 85% of all farms on the planet today. In over two-thirds of all countries, small farms – as defined in each country – represent more than 80% of all farms. In only nine countries, all of them in Western Europe, are small farms a minority.8
How many small farms are there – and how much land do they have?
Click here to view in full screen
Due to a myriad of forces and factors (such as land concentration, population pressure or lack of access to land) most small farms have been getting smaller over time. Average farm sizes have shrunk in Asia and Africa. In India, the average farm size roughly halved from 1971 to 2006, doubling the number of farms measuring less than two hectares. In China, the average area of land cultivated per household fell by 25% between 1985 and 2000, after which it slowly started to increase due to land concentration and industrialisation. In Africa, average farm size is also falling.9 In industrialised countries, where the industrialisation of agriculture is rampant, average farm size is increasing, but not the size of small farms.
Table 1: Global distribution of agricultural land
| Agricultural land (thousands of ha) | Number of farms (thousands) | Number of small farms (thousands) | Small farms as % of all farms | Agricultural land in the hands of small farmers (thousands of ha) | % of agricultural land in the hands of small farmers | Average size of small farms (ha) | |
| Africa | 1,242,624 | 94,591 | 84,757 | 89.6% | 182,766 | 14.7% | 2.2 |
| Asia-Pacific | 1,990,228 | 447,614 | 420,348 | 93.9% | 689,737 | 34.7% | 1.6 |
| China | 521,775 | 200,555 | 200,160 | 99.8% | 370,000 | 70.9% | 1.8 |
| India | 179,759 | 138,348 | 127,605 | 92.2% | 71,152 | 39.6% | 0.6 |
| Europe | 474,552 | 42,013 | 37,182 | 88.5% | 82,337 | 17.4% | 2.2 |
| Latin America & Caribbean | 894,314 | 22,333 | 17,894 | 80.1% | 172,686 | 19.3% | 9.7 |
| North America | 478,436 | 2,410 | 1,850 | 76.8% | 125,102 | 26.1% | 67.6 |
| TOTAL | 5,080,154 | 608,962 | 562,031 | 92.3% | 1,252,628 | 24.7% | 2.2 |
| Notes: All figures on agricultural land obtained from FAOSTAT. Figures on number and size of farms obtained from national authorities wherever possible. Click to download the full dataset as a spreadsheet. | |||||||
2. Small farms are being squeezed onto less than a quarter of global agricultural land
Table 1 reveals another stark fact: globally, small farms have less than 25% of the world's farmland today. If we exclude India and China again, then the reality is that small farms control less than a fifth of the world's farmland: 17.2% to be precise.
We find the most extreme disparities in some 30 of the countries for which we have sufficient data. Here, more than 70% of farms are small, but they are relegated to less than 10% of the country's farmland. These worst cases are listed in Table 2.
Table 2: Worst off
| Countries where more than 70% of farms are small yet control less than 10% of domestic agricultural land | |
| Africa | Algeria, Angola, Botswana, Congo, DR Congo, Guinea, Guinea-Bissau, Lesotho, Madagascar, Mali, Morocco, Mozambique, Namibia, Zambia |
| Americas | Chile, Guyana, Panama, Paraguay, Peru, Venezuela |
| Asia | Iran, Jordan, Kyrgyzstan, Lebanon, Malaysia, New Zealand, Qatar, Turkmenistan, Yemen |
| Europe | Bulgaria, Czech Republic, Russia |
Source: Land distribution dataset compiled by GRAIN.
Box 1: A word about Africa
As can be seen in Table 1, we find that small farms in Africa represent almost 90% of all farms but have less than 15% of the total agricultural land. Our figures contradict the frequent assertion that most farmland in Africa is managed by small farmers.10
Data on who uses what land in Africa are hard to get. Most of Africa's traditional land tenure systems have been seriously eroded and even dismantled, beginning in colonial times. In many countries, ownership of land has been vested in the state or allocated to plantation companies or local chiefs. This has profound implications for classifying land and accounting for its use.11
Additionally, there is the problem of defining what constitutes agricultural land. In many cases, African governments measure “agricultural land” as the area being used by sedentary farmers at a given period of time, thereby leaving out large areas of land used by pastoralists for seasonal grazing. Also, land under fallow, shifting cultivation and land used by communities that farm within forest areas are often excluded.12 The FAO, by contrast, includes permanent pastures, uncultivated savannah and lands sown to permanent crops in its definition of agricultural land.
As a consequence, most national censuses in Africa register just a fraction of the area of agricultural land recorded by the FAO – less than half, as far as the entire region is concerned. The FAO's approach is a more realistic and inclusive way of measuring land use by small producers, which is why we used FAOSTAT's figures to establish the amount of farmland in Africa.
Where land is assumed to belong to the State – and is not accounted for as cropped or used by local farmers – this provides a basis for land grabbing by big farmers and companies, the rationale being that they will develop the unused land. Under customary law, however, these lands belong to the local communities and are often actively used.
Given that we used, wherever possible, national census data provided by governments to calculate the amount of land in the hands of small farmers, it is possible and even likely that we underestimate the situation in Africa. Small farmers in Africa are probably using much more than the 15% of the region's farmland than we our data shows – but communities' access to that land is not guaranteed and can be lost at any moment.
3. We're fast losing farms and farmers in many places, while big farms are getting bigger
Almost everywhere, big farms have been accumulating more land over the last decades, with many small and medium-sized farmers going out of business. The statistics are dramatic. The official data that we were able to access are summarised in Table 3.
The situation seems most dramatic in Europe, where decades of EU agricultural policies have led to the loss of millions of farms. In Eastern Europe, the process of land concentration started earnestly after the fall of the Berlin Wall and the enlargement of the European Union. Millions of farmers were forced out of business by the opening up of East European markets to subsidised farm produce from the West. In Western Europe, meanwhile, biased agricultural policies coupled with large scale infrastructure, transportation and urbanisation projects have been taking a vicious toll. Large farms now represent less than 1% of all farms in the European Union as a whole, but control 20% of EU farmland.13, 14 A recent report by the European Coordination of La Via Campesina and the Hands off the Land Alliance found that in the EU, farms of 100 hectares or more, which represent only 3% of the total number of farms, now control 50% of all farmed land.15
Table 3: Losing farms, concentrating land
| Africa | While we found no official statistics on the evolution of farms and land concentration in Africa, numerous research papers indicate that in a great majority of countries, small farms are getting smaller because, with population pressure, farmers have to share access to existing land among more people while gaining no access to new land.16 |
| Asia- Pacific | ▪ Between 1980 and 2005, Japan lost 60% of its farms under 2 ha.17 |
| Europe23 | ▪ In Western Europe, Belgium, Finland, France, Germany and Norway have lost around 70% of their farms since the 1970s, and in some cases this trend is growing. ▪ Things are no better in Eastern Europe. From 2003 to 2010, Bulgaria, Estonia, the Czech Republic and Slovakia lost over 40% of their farms. ▪ Poland alone lost almost 1 million farmers between 2005 and 2010. ▪ Within the EU as a whole, over 6 million farms disappeared between 2003 and 2010, bringing the total number of farms down to almost the same level as in 2000, before the inclusion of 12 new member states with their 8.7 million new farmers. |
| Latin America | ▪ Argentina lost more than one-third of its farms in the two decades from 1988 to 2008; between 2002 and 2008 alone, the decline was 18%.24 ▪ In the decade from 1997 to 2007, Chile lost 15% of its farms. The biggest farms, those holding more than 2,000 ha, shrank 30% in number but doubled their average size, from 7,000 to 14,000 ha per farm.25 ▪ In Colombia, small farmers have lost around half of their land since 1980.26 ▪ In Uruguay, just since 2000, the number of farms has dropped 20% and this especially affects small farms: there are 30% fewer small farms, and they have 20% less land.27 |
| United States | The United States has lost 30% of its farms in the last 50 years. However, the number of very small farms has almost tripled, while the number of very large farms has more than quintupled.28 So there are more very small and very large farms, but fewer medium-sized farms.29 |
Official data on farm losses and land concentration in Africa and Asia are harder to get, and the situation there is less clear, since contradictory factors and forces are often at play. In many countries with high levels of population growth, the number of small farms actually increases as small farms are divided up between children. But at the same time, land concentration is growing.
The rapid expansion of huge industrial commodity farms is a relatively recent phenomenon in Africa, while it has been going on for decades in many countries of Latin America (e.g. soybeans in Argentina and Brazil) and in several parts of Asia (e.g. oil palm in Indonesia and Malaysia). Box 2 and Graph 2 give the background and figures for a few major industrial crops. The conclusion is inescapable: across the world more and more fertile agricultural land is occupied by huge farms to produce industrial commodities for export, pushing small producers into an ever decreasing share of the world's farmland.
Box 2: The invasion of the mega-farms
Why are small farmers increasingly pushed into an ever smaller corner of the world's farmland? There are many complex factors and forces at play. one is population growth in rural areas in many countries, where small farmers are increasingly forced to divide their land among their children, resulting in smaller and smaller farms, as they have no access to more land. Another is urbanisation and the covering of fertile farmland with concrete to serve expanding cities and their transportation needs. Yet others are the burgeoning spread of extractive industries (mining, oil, gas and now fracking), tourism, and infrastructure projects – and the list goes on.
Overwhelming as these pressures are, perhaps the single most important factor in the drive pushing small and medium-sized farmers onto ever smaller parcels of land is the tremendous expansion of industrial commodity crop farms. The powerful demands of food and energy industries are shifting farmland and water away from direct local food production to the production of commodities for industrial processing. Graph 2 shows how just four crops – soybean, oil palm, rapeseed and sugar cane – have quadrupled the amount of land they occupy over the past five decades. All are grown mainly on big industrial farms.
A massive 140 million hectares of fields and forests have been taken over by these plantations since the 1960s. To put things in perspective: this roughly the same area as all the farmland in the European Union. And the invasion is clearly accelerating: almost 60% of this land use change occurred in the last two decades. This doesn't take into account any of the other crops that are fast being turned into industrial commodities produced on mega-farms or the tremendous growth of the industrial forestry sector. The FAO calculates that in developing countries alone, monoculture tree plantations grew by over 60%, from 95 to 154 million ha, just between 1990 and 2010. Others put this figure higher, and point out that the trend is accelerating.30 Many of these new plantations are encroaching on natural forests, but they are also increasingly taking over farmland.
A research team in Austria analysed trade flows of agricultural crops in relation to land use. They concluded that the global area of farmland dedicated to export crop production grew rapidly – by about 100 million ha during the past two decades – while the area producing crops for direct domestic use remained virtually unchanged.31
Without significant changes in government policies, this aggressive attack by commodity monocultures is set to expand further. According to the FAO, between now and 2050 the world's soybean area is set to increase by one-third to some 125 million ha, the sugar cane area by 28% to 27 million hectares, and the rapeseed area by 16% to 36 million hectares.32 As for oil palm, there are currently 15 million hectares under production for edible palm oil (not biofuels), and this is expected to nearly double, with an additional 12-29 million hectares coming into production by 2050.33 Much of this expansion will happen in Africa, Asia and Latin America. Soybean and sugar cane are today mostly produced in Latin America, and oil palm in Asia, but these crops are also now being pushed aggressively into Africa as part of the global wave of land grabbing.
This trend is compounded by yet another recent phenomenon: the new wave of land grabbing. The World Bank has estimated that between 2008-2010 at least 60 million hectares of fertile farmland were leased out or sold to foreign investors for the purpose of large scale agricultural projects, with more than half of this in Africa.34 These massive new agribusiness projects are throwing an incalculable number of small farmers, herders and indigenous people off their territories.35 Yet no one seems to have a real grasp of how much land has changed hands through these deals over the last few years. The scores, possibly hundreds, of millions of hectares of agricultural land being taken away from rural communities are not yet captured in the official statistics that were available for this report.
Another way of looking at land distribution is through the Gini index, a statistical tool that ranges from 0 (indicating perfect equity) to 1 (total inequity). For example, when calculated for income distribution, countries with a Gini index above 0.5 are considered "highly unequal". GRAIN gathered Gini indices for agricultural land distribution in more than 100 countries.36Most have indices exceeding 0.5, with many reaching 0.8 and some even surpassing 0.9. In the Americas, all countries for which we found information have indices over 0.5, and most of them reach to 0.8-0.9. In Europe, of the 25 countries for which this information is available, only three have an index under 0.5. Where more than a single year's data was available, the most common tendency was for the index to go up, indicating that land inequality is increasing.
4. Despite their scarce and dwindling resources, small farmers continue to be the world's major food producers

At a time when agriculture is almost exclusively judged in terms of its capacity to produce commodities, one tends to forget that the main role of farming is feeding people. This bias has infiltrated national census data, too, as many nations do not include questions about who produces what and with what means. However, when that information is available, a clear picture emerges: small farmers still produce most of the food. They are feeding the world. The UN Environment Programme, the International Fund for Agricultural Development, FAO and the UN Special Rapporteur on the Right to Food all estimate that small farmers produce up to 80% of the food in the non-industrialised countries.37
Table 4 shows the percentage of food produced by small farms in those countries where GRAIN was able to obtain good data. Across a diverse range of countries, the data shows that small farmers produce a much larger proportion of their nations' food than might be expected from their limited landholdings.
Table 4: Lots of food from little land
| Belarus | With 17% of the land, small farmers produce: 87.5% of fruits and berries, 82% of potatoes, 80% of vegetables and 32% of eggs38 |
| Botswana | Small farms are 93% of all farmers, have less than 8% of the agricultural land, and produce: 100% of the country's groundnuts, 99% of its maize, 90% of the millet, 73% of beans and 25% of the sorghum39 |
| Brazil | 84% of farms are small and control 24% of the land, yet they produce: 87% of cassava, 69% of beans, 67% of goat milk, 59% of pork, 58% of cow milk, 50% of chickens, 46% of maize, 38% of coffee, 33.8% of rice and 30% of cattle40 |
| Central America | With 17% of the agricultural land, small farmers account for 50% of all agricultural production41 |
| Chile | In 1997, small farmers owned 6% of the land and produced: 51% of vegetables, 40% of field crops, 26% of industrial crops (sugar beet, sunflower, rapeseed), 23% of the fruits and vineyards, 22% of cereals and 10% of pastures42 |
| Cuba | With 27% of the land, small farmers produce: 98% of fruits, 95% of beans, 80% of maize, 75% of pork, 65% of vegetables, 55% of cow milk, 55% of cattle and 35% of rice43 |
| Ecuador | Almost 56% of farmers are small and have less than 3% of the land but produce: more than half of vegetables, 46% of maize, over a third of cereals, over a third of beans, 30% of potatoes and 8% of rice44 |
| El Salvador | With just 29% of the land, small farmers produce: 90% of beans, 84% of maize and 63% of rice, the three basic staple foods. Backyard farmers, with even smaller land areas, provide 51% of the country's pork, 20% of its poultry and most of its traditional fruits.45 |
| Hungary | Small farms control 19% of the land and obtain 25% of the agricultural sector's total standard gross margin46 |
| Kazakhstan | Just over 97% of farms are small and operate on 46% of the land, producing: 98% of fruits and berries, 97% of milk, 95% of potatoes, 94% of melons, 94% of vegetables, 90% of meat, 78% of sugar beet, 73% of sunflower, 51% of cereals and 42% of eggs47 |
| Kenya | With just 37% of the land, small farms produced 73% of agricultural output in 200448 |
| Romania | Family farms are 99% of all farms, and have 53% of the land, with an average of 1.95 ha/farm. They keep: 99% of sheep, 99% of goats, 99% of bees, 90% of cattle, 70% of pigs and 61% of poultry49 |
| Russia | Small farms have 8.8% of the land, but provide 56% of agricultural output, including: 90% of potatoes, 83% of vegetables, 55% of milk, 39% of meat and 22% of cereals50 |
| Tajikistan | Small farms have 45% of the land yet account for 58% of all agricultural production51 |
| Ukraine | Small farmers operate 16% of agricultural land, but provide 55% of agricultural output, including: 97% of potatoes, 97% of honey, 88% of vegetables, 83% of fruits and berries and 80% of milk52 |
If small farmers have so little land, how can they provide most of the food in so many countries? one reason is that small farms tend to be more productive than big ones, as we explain in the next section. But another factor is this historical constant: small or peasant farms prioritise food production. They tend to focus on local and national markets and their own families. Much of what they produce doesn't enter into national trade statistics, but it does reach those who need it most: the rural and urban poor.
Big corporate farms, on the other hand, tend to produce commodities and concentrate on export crops, many of which people can't eat as such. These include plants grown for animal feed or biofuels, wood products and other non-food crops. The primary concern for corporate farms is their return on investment, which is maximised at low levels of spending and thus often implies less intensive use of the land. The expansion of giant monoculture plantations, as discussed earlier, is part of this picture. Large corporate farms also often have considerable reserves of land that lie unused until land that is currently being cropped or grazed is exhausted.
Small farmers are not only our main source of food at present, but also for the future. International development agencies are constantly warning that we need to double food production in the coming decades. To achieve that, they usually recommend a combination of trade and investment liberalisation plus new technologies. But this will only create more inequality. The real solution is to turn control and resources over to small producers themselves and enact agricultural policies to support them.
In a recent paper on small farmers and agroecology, the UN Special Rapporteur on the Right to Food concludes that global food production could be doubled within a decade if the right policies towards small farmers and traditional farming were implemented. Reviewing the currently available scientific research, he shows that agroecological initiatives by small farmers themselves have already produced an average crop yield increase of 80% in 57 developing countries, with an average increase of 116% among all African initiatives assessed. Recent projects conducted in 20 African countries provided a doubling of crop yields in a short period of just three to ten years.53
The real question, then, is how much more food could be produced if small farmers had access to more land and could work in a supportive policy environment rather than under the siege conditions they are facing today?
5. Small farms not only produce most of the food, they are also the most productive

For some, the idea that small farms are more productive than big farms might seem counterintuitive. After all, we have been told for decades that industrial farming is more efficient and more productive. It's actually the other way around. The inverse relationship between farm size and productivity has been long established and is dubbed “the productivity paradox”.54
In the European Union, 20 countries register a higher rate of production per hectare on small farms than on large farms. In nine EU countries, productivity of small farms is at least twice that of big farms.55 In the seven countries where large farms have higher productivity, it is only slightly higher than that of small farms.56 This tendency is confirmed by numerous studies in other countries and regions, all of them showing higher productivity on small farms.
Our data indicate, for example, that if all farms in Kenya had the current productivity of the country's small farms, Kenya's agricultural production would double. In Central America and Ukraine, it would almost triple. In Hungary and Tajikistan it would increase by 30%. In Russia, it would be increased by a factor of six.57
Although big farms generally consume more resources, control the best lands, receive most of the irrigation water and infrastructure, get most of the financial credit and technical assistance, and are the ones for whom most modern inputs are designed, they have lower technical efficiency and therefore lower overall productivity. Much of this has to do with low levels of employment used on big farms in order to maximise return on investment.58
Beyond strict productivity measurements, small farms also are much better at producing and utilising biodiversity, maintaining landscapes, contributing to local economies, providing work opportunities and promoting social cohesion, not to mention their real and potential contribution to reversing the climate crisis.59
6. Most small farmers are women, but their contributions are ignored and marginalised
The role of women in feeding the world is not adequately captured by official data and statistical tools. FAO, for example, define only as people who get a monetary income from farming as “economically active in agriculture”. Using this concept, FAOSTAT indicates that 28% of the rural population in Central America are “economically active” and that women form just 12% of that group!60
This distorted view does not change significantly from country to country. However, when data is more specific, a totally different picture emerges. The last published agricultural census figures from El Salvador indicate that women are just 13% of “producers”, meaning farm holders, much in line with the number provided by FAO.61 However, the same census indicates that women provide 62% of the labour force used on family farms. The situation in Europe is better for women, but still highly unequal. There, the data show that women comprise less than a quarter of farm holders and on average have smaller farms than men, but provide almost 50% of the family labour force.62

Statistics about the role of women in Asia and Africa are difficult to obtain. According to FAOSTAT, only 30% of the rural population in Africa is economically active in agriculture and 40% in Asia – around 45% being women and 55% men.63 Yet studies carried out or cited by FAO show totally different numbers, indicating that in non-industrialised countries 60 to 80% of the food is produced by women.64 In Ghana and Madagascar, women make up about 15% of farm holders, but provide 52% of the family labour force and constitute around 48% of paid workers.65 In Cambodia, just 20% of agricultural land holders are women, but they provide 47% of the paid agricultural force and almost 70% of the labour force on family farms.66 In the Republic of the Congo, women provide 64% of all agricultural labour and are responsible for around 70% of food production.67 In Turkmenistan and Tajikistan, they are 53% of the active population in agriculture.68 There is very little data on the evolution of the contribution of women to agriculture, but their share would likely be growing, since migration is resulting in mostly women and girls picking up the workload of those who leave.69
According to FAO, fewer than 2% of landholders worldwide are women, but figures vary widely.70 There is broad consensus, however, that even where land is registered as family or joint property between men and women, men still enjoy much wider powers over it than do women. For example, a common situation is that men can make decisions about the land on behalf of themselves and their spouses, but women cannot. Another impediment is that in giving credit, governments and banks require women to present some form of authorisation from their husbands or fathers, while men encounter no such barrier. It is no surprise, then, that available data show that only 10% of agricultural loans go to women.71
Additionally, inheritance laws and customs often work against women. Males tend to have priority or outright exclusivity in the inheritance of land. In many countries, women can never gain legal control over land, with authority passing to their sons if they are widowed for example.
The data above support the contention that women are the main food producers on the planet, although their contribution remains ignored, marginalised, and discriminated against.
Reversing the trend: give small farmers the means to feed the world
As the data show, land concentration in agriculture is reaching extreme levels. Today, the vast majority of farming families have less than two hectares to feed themselves and humankind. And the amount of land they have access to is shrinking. How are small farmers supposed to sustain themselves in these conditions?
Most families that depend on a small farm need to have family members working outside the farm in order to be able to stay on the land. This situation is often described euphemistically as "diversification", but in reality it means accepting low wages, and bad working conditions. For the rural families of many countries, it means mass migration leading to permanent insecurity both for those who leave and for those who stay. Also, living and working on a small farm often consists of long and difficult working hours, no holidays, no pensions, no retirement for the elderly and irregular school attendance for children.

If this land concentration process continues, then no matter how hard-working, efficient and productive they are, small farmers will not be able to carry on. The concentration of fertile agricultural land in fewer and fewer hands is directly related to the increasing number of people going hungry every day. Genuine land reform is not only necessary, it is urgent. And it must carried out in line with the needs of peasant families and small producer communities. one of these needs is that land be redistributed to small farmers as an inalienable good, not as a commercial asset that can be lost if rural families are not able to cope with the highly discriminatory situations that they face. Farming communities should also be able to decide by and for themselves, and without pressure, the type of land tenure they want to practice.
The situation facing women farmers also requires urgent action. Many international agencies and governments are currently discussing these issues. Land access for women is specifically part of the Millennium Development Goals. The FAO has written numerous documents advocating for women's rights over land and agricultural resources. The issue is being considered by the UN Development Programme, the World Bank, the Gates Foundation, the G8 and the G20, among others. However, what these institutions are advocating is often not what women farmers and women's organisations have been struggling for. Such institutions often advocate a system of land rights based on individual property titles that can be bought and sold or used as collateral. This is likely to lead to further concentration of land, just as the allocation of individual land property rights to men has done historically around the world.72
Doing nothing to turn this situation around will be disastrous for all of us. Small farmers – the vast majority of farmers, who tend to be the most productive and who produce most of the world's food – are losing the very basis of their livelihoods and existence: their land. If we do nothing, the world will lose its capacity to feed itself. The message, then, is clear. We urgently need to launch, on a scale never seen before, genuine agrarian reform programmes that get land back in the hands of small and peasant farmers.
Annex 1: The data
What sources of data were used?
Gathering and analysing data on land distribution and food production raises major questions and problems. First, data on farms, farmers, rural people and food are often patchy, slanted, or influenced by the politics of those who collect them. Second, classification criteria and definitions are highly variable.
Although government statistics are no exception to such problems, we have used government sources, most often provided by national agricultural censuses, as much as possible because they provide the most comprehensive data. We also used data provided by FAOSTAT and other FAO sources, and we incorporated data from research papers when other data was not available at national level. This means that we have used data from various years, in some cases from 10 or more years ago. If this had any impact on our results, it is most likely that the amount of land in the hands of small farmers has been overestimated, since with few exceptions the worldwide trend is towards less land in the hands of small farmers. The sources for each case are indicated in the dataset accompanying this report.73
Outside Europe and the Americas, data for around one-quarter of the world's countries – representing around 12% of all agricultural land and about the same fraction of global rural population – was either partial or not available. We estimated the number of farms and small farms and the amount of land in the hands of small farmers in these countries based on total agricultural land (provided by FAOSTAT), rural population (provided by UN Department of Economic and Social Affairs) and average household size per country (provided by UN Habitat).
What definition of small farms was used?

What is a small farm? The area of land it occupies is not the only significant parameter. Twenty hectares may be very big in India but very small in Argentina. Access to irrigation, the fertility of the soil, the type of production being undertaken, climate and topography are all factors in determining what is considered a small farm and what is not. There is clearly no universal definition of a small farm, and GRAIN had no possibility of adopting one. Building or proposing an all-encompassing definition was impossible because in many cases it would have rendered the available data inapplicable or impossible to interpret.
We also avoided the concept of "family farm" that FAO and others are now promoting in the context of the International Year of Family Farming. Although it can be a meaningful concept in many countries, the definitions used are so broad and ambiguous that they can hide serious contradictions, sometimes with unintended consequences. In addition, few official statistics provide data on family farming.
Hence, we decided to use the definition of “small farms” provided by the national authorities of each country. When such criteria were not available, we adopted the definition of the World Bank (farming households with less than 2 hectares). An exception was made in the case of the US, where according to official criteria any farm with an annual turnover of less than US$250,000 is considered small. Given that this would seriously contradict other criteria on what a small farm is (such as the destination of production or the source of labour), we opted for the criterion put forward by Lincoln University in Nebraska, which defines a small farm in the US as one with a turnover of US$50,000 or less per year.
We have, therefore, used several definitions of small farms in this report. These definitions are based on data and measurements as disparate as gross income, gross sales, amount of land, source of farm labour and type of resources – or combinations of these. Still, we believe that this approach gives the best approximation of reality, since the criteria used by each country do represent certain aspects of small farms.
What kind of land are we talking about?
Farmers, and more so small farmers, carry out a wide range of agricultural activities under quite diverse arrangements. These include intensive management of horticultural crops, crop rotations with annual forages, agroforestry, shifting cultivation, livestock rearing, fish farming and pastoralism, or any combination of these.
Governments and FAO classify land under different categories according to how the land is used, and they collect data accordingly. The EU accounts for all the land within a farm, no matter how it is being cropped or utilised. The same holds for the US, Brazil, Argentina and India. But in Africa, many governments exclude communal land and grazing areas from the statistics, thus greatly underestimating the land area used by farmers. once again, different criteria are being employed, and we had no means of selecting or disaggregating data (for example, cropped land versus total agricultural land) governments or other agencies had collected under a single heading.
The FAO provides figures on total agricultural land for almost every country in the world, even for those where no census data are available, and defines total agricultural land as the sum of the following areas:
- arable land - land under temporary agricultural crops, temporary meadows for mowing or pasture, land under market and kitchen gardens and land temporarily (for less than five years) fallow.
- permanent crops - land cultivated with long-term crops which do not have to be replanted for several years (such as cocoa and coffee); land under trees and shrubs producing flowers, such as roses and jasmine; and nurseries (except those for forest trees, which should be classified under "forest").
- permanent meadows and pastures - land used permanently (for five years or more) to grow herbaceous forage crops, either cultivated or growing wild (wild prairie or grazing land).74
We used the FAO's more inclusive definition and the associated statistics to calculate the total agricultural land in each country.
Missing: the landless, the urban food producers, extractive industries and land grabbing
Our research left out numerous realities, either because they were outside the scope of this study or because we did not find enough data. one important missing element is the situation of landless food producers and workers. Landlessness is a major and increasing reality in many countries, as the Movimento dos Trabalhadores Sem Terra (MST), the largest social movement in Brazil, so clearly testifies. Nor did we examine urban food producers, an increasingly important factor in global food production. Very few countries provide data on them, and we could not compile significant figures on their situation worldwide.
Through our work and that of our partners, GRAIN is keenly aware that urbanisation, the extractive industries, hydroelectric dams and many other industrial mega projects are increasingly advancing over farmland, forest lands, water sources, farming communities and indigenous peoples' territories. They are massively affecting the availability of agricultural land in the world, but since much of their rapid expansion is relatively recent, they are often not adequately addressed in agricultural land statistics.
And finally, also missing in our calculations is the recent wave of land grabbing that is now handing millions of hectares of fertile farmland to large corporations and depriving tens of thousands of farming communities of their livelihoods. Today's massive land grab took off only in the last decade and has yet to be captured in the official statistics.
1 Graziano da Silva, opening speech at the Global Forum on Family Farming, Budapest, 5 March 2014. http://tinyurl.com/nmkhffc.
2 Sarah K. Lowder, Jakob Skoet and Saumya Singh, “What do we really know about the number and distribution of farms and family farms in the world?” Background paper for The State of Food and Agriculture 2014. FAO April 2014. Figure quoted on page 8.http://tinyurl.com/qh6ql7l. See also: FAO, "Family farmers - feeding the world, caring for the earth", 2014, http://tinyurl.com/osuelv8
3 Beverly D. McIntyre (editor), IAASTD "International assessment of agricultural knowledge, science and technology for development: global report", 2008, page 8,http://tinyurl.com/mlmuzqy
4 Wenbiao Cai, a professor at the University of Winnipeg, states in several studies that small farms account for most of the farmland in the non-industrialised world. Other examples include allies of small farmer movements like Miguel Altieri, who says that small farms in Latin America "occupy 34.5% of the total cultivated land" (http://tinyurl.com/qxxxf5u), or Greenpeace, who say that "Small-scale farmers form the larger part of global agricultural land" (http://tinyurl.com/p233eef).
5 A number of people generously took time to review and comment on earlier drafts of this report or help us with certain problems. Their inputs were very useful and we are grateful to all of them. They include: Maria Aguiar, Valter Israel da Silva, Thomas Kastner, Carlos Marentes, Pat Mooney, Ndabezinhle Nyoni, Jan Douwe van der Ploeg, Mateus Santos, Chris Smaje and Liz Aldin Wiley.
6 When we talk about "farmers" or "peasants" in this report, we mean food producers including people who raise livestock, such as herders or pastoralists, fishers, hunters and gatherers.
7 The land distribution dataset compiled by GRAIN can be downloaded here.
8 Belgium, Denmark, Finland, France, Germany, Ireland, Luxembourg, Netherlands and Norway.
9 Peter Hazell, “Is small farm led development still a relevant strategy for Africa and Asia?”, 2013: http://ppafest.nutrition.cornell.edu/authors/hazell.html
10 For example, FAO affirms that “Eighty percent of the farmland in sub-Saharan Africa and Asia is managed by smallholders” in "Smallholders and family farmers", 2012:http://tinyurl.com/nb5t5jx
11 The discussion of some specific country cases can be seen in “Land Tenure and Administration in Africa: Lessons of Experience and Emerging Issues” by Lorenzo Cotula, Camilla Toulmin and Ced Hesse; in “Paradigms, processes and practicalities of land reform in post-conflict Sub-Saharan Africa” by Chris Huggins and Benson Ochieng; in “Land tenure and violent conflict in Kenya in the context of local, national and regional legal and policy frameworks” by Judi Wakhungu, Elvin Nyukuri and Chris Huggins; in “Land reform in Angola: establishing the ground rules” by Jenny Clover, as well as in “Land reform processes in West Africa: a review” by SahelSahel and West Africa Club Secretariat
12 This is the case, for example, of Botswana (2011 Annual Agricultural Survey Report) that does not account the land used for traditional livestock rearing, although traditional herds of cattle and goats are composed of more than 4 million head. It is also the case of the World Bank, which states that “Land abandoned as a result of shifting cultivation is excluded” from their definition of agricultural land.
13 EUROSTAT, Statistics in focus 18/2011, "Large farms in Europe",http://epp.eurostat.ec.europa.eu/cache/ITY_OFFPUB/KS-SF-11-018/EN/KS-SF-11-018-EN.PDF
14 Unless otherwise stated, figures on countries of the European Union are based on the Agricultural Structure Survey of 2007, as published data from the 2010 survey did not allow us to do the necessary calculations.
15 ECVC and HOTL, "Land concentration, land grabbing and people’s struggles in Europe", 17 April 2013. www.eurovia.org/IMG/pdf/Land_in_Europe.pdf
16 O. Nagayets, "Small farms: current status and key trends", 2005http://tinyurl.com/ocp7quw
17 Statistics Bureau, Government of Japan, “Agriculture”,http://www.stat.go.jp/english/data/chouki/07.htm
18 Government of Australia, “Australian farmers and farming”, Dec 2012,http://www.abs.gov.au/AUSSTATS/abs@.nsf/Lookup/4102.0Main+Features10Dec+2012#FARMING
19 Stephanie Mulet-Marquis and John R. Fairweather, “New Zealand farm structure change and intensification”, Lincoln University, 2008,http://www.lincoln.ac.nz/Documents/4322_RR301_s14339.pdf.
20 I Wayan Rusastra, "Land economy for poverty reduction: Current status and policy implications"; Capsa Palawija News, April 2008; Indonesia Agricultural Census 1963, 1993, 2003. Main Results; Lani Eugenia, "Significance of family farming in the Asian Region: The Indonesian agriculture sector"
21 State Statistical Committee of the Republic of Azerbaijan. "The Agriculture of Azerbaijan. Statistical yearbook 2012"
22 "Preliminary report on agriculture sample survey 2005", Bangladesh Bureau of Statistics, 2005
23 All figures for countries of the European Union were obtained from EUROSTAT, http://tinyurl.com/kbmom54 and http://tinyurl.com/l9aqu39. Country specific data can be found by searching “farm structure survey [name of country]”
24 See Argentine government statistics at http://www.indec.gov.ar/default_cna.htm andhttp://www.indec.gov.ar/censoAgro2008/cna08_10_09.pdf
25 Government of Chile, Agricultural census,http://www.ine.cl/canales/chile_estadistico/censos_agropecuarios/censos_agropecuarios.php
26 A.M. Ibañez. "La concentración de la propiedad rural en Colombia: evolución 2000 a 2009, desplazamiento forzoso e impactos sobre el desarrollo económico" (PRIO, Policy brief 5/2009); Oxfam. "Divide and purchase. How land is being concentrated in Colombia"; Y. Salinas. "El caso de Colombia". Study on landgrabbing commissioned by FAO LAC Regional Office
27 Government of Uruguay, “Censo 2011”, http://www.mgap.gub.uy/portal/hgxpp001.aspx?7,5,149,O,S,0,MNU;E;55;1;MNU and “Censo general agropecuario 2000”,http://www.mgap.gub.uy/Dieaanterior/CENSOVOL2/data/11.htm
28 Tables with government data can found athttp://www.agcensus.usda.gov/Publications/index.php.
29 James MacDonald et al, "Farm size and the organisation of US crop farming" Economic Research Report No. 152, USDA, Aug 2013, http://tinyurl.com/m8lqvyv
30 See World Rainforest Movement, “An overview of industrial tree plantations in the global South: conflicts, trends, and resistance struggles”, 2012, for a discussion on this.
31 EJOLT, “The many faces of landgrabbing”, EJOLT briefing, 10 March 2014.
32 Nikos Alexandratos and Jelle Bruinsma, “World agriculture towards 2030/2050. The 2012 revision”, FAO, 2012
33 Corley, R.H.V. (2009): How much palm oil do we need? Environmental Science & Policy 12: 134-139 http://www.sciencedirect.com/science/article/pii/S1462901108001196
34 Other agencies like the International Land Coalition-led Land Matrix put the figure at 203 million hectares but over a ten year period (2000-2010):http://www.landcoalition.org/sites/default/files/publication/1205/ILC%20GSR%20report_ENG.pdf
35 See http://farmlandgrab.org for a range of published reports and day to day accounts.
37See, for example, Kanayo F. Nwanze, IFAD. "Small farmers can feed the world"; UNEP, "Small farmers report"; FAO, "Women and rural employment fighting poverty by redefining gender roles" (Policy Brief 5)
38 National Statistical Committee of the Republic of Belarus, "Agriculture of the Republic of Belarus" 2013
39 Statistics Botswana, "Stats brief", 2009 and 2010 annual agricultural surveys preliminary results
40 Instituto Brasileiro de Geografia e Estadistica, "Censo Agropecuario 2006",http://tinyurl.com/m376s82
41 Eduardo Baumeister. "Características económicas y sociales de los agricultores familiares en América Central." INCEDES, 2010. http://tinyurl.com/n33wlh9
42 Instituto Nacional de Estadísticas de Chile, http://www.ine.cl, "Censo Agropecuario 1997".
43 Braulio Machin Sosa et al., ANAP-Via Campesina, "Revolución agroecológica, resumen ejecutivo"
44 Instituto Nacional de Estadísticas y Censos, Censo Nacional Agropecuario 2000, http://tinyurl.com/ngvm5te
45 IV Censo Agropecuario 2007-2008. Ministerio de Economía de El Salvador. http://tinyurl.com/qatfm5y
46 Hungarian Central Statistical Office, "Total Standard Gross Margin of farms engaged in agricultural activity by type of farming and size class, 2007" 2/2 (Million HUF).
47 Agency on Statistics of the Republic of Kazakhstan, Statistical Yearbook "Kazakhstan in 2009"
48 Hans P. Binswanger-Mkhize et al (eds). "Agricultural land redistribution. Toward greater consensus". 2009.
49 National Institute of Statistics, press release No. 149 of July 2, 2012, "General agricultural census 2010"
50 Russian Federation Federal State Statistics Service, Russia in Figures 2011.
51 Hebrew University of Jerusalem. Dept of Ag Economic Research, Economics and Management. Discussion paper No. 16.08. "The economic effects of land reform in Central Asia: The case of Tajikistan"
52 State Statistics Service of Ukraine. "Main agricultural characteristics of households in rural areas in 2011"
53 Olivier de Schutter, “Agroecology and the Right to Food”, Report presented at the 16th Session of the United Nations Human Rights Council [A/HRC/16/49], 8 March 2011,http://tinyurl.com/nmxyf87
54 See, for example: Michael Carter, “Identification of the inverse relationship between farm size and productivity: an empirical analysis of peasant agricultural production”; IFAD, “Assets and the rural poor. Poverty Report 2001”; Giovanni Andrea Cornia, “Farm size, land yields and the agricultural production function: An analysis for fifteen developing countries;” H.N. Anyaegbunam, P.O. Nto, B.C. Okoye and T.u. Madu, “Analysis of determinants of farm size productivity among small-holder cassava farmers in south east agroecological zone, Nigeria”.
55 The nine countries are Austria, Bulgaria, Greece, Italy, Netherlands, Portugal, Romania, Spain and the United Kingdom. See "Large farms in Europe", Eurostat Statistics in Focus 18/2011, http://tinyurl.com/ny3qsgv.
56 Czech Republic, Estonia, Ireland, Latvia, Lithuania, Slovakia and Sweden. Ibid
57 These figures are obtained by extrapolating the productivity of small farms indicated in the sources for table 4 to 100% of agricultural land.
58 Jan Douwe van der Ploeg, University of Wageningen, personal communication, 25 March 2014.
59 For a discussion of food systems and the climate crisis, see: GRAIN “Food and climate change, the forgotten link”, Sep 2011. http://www.grain.org/e/4357
61 Government of El Salvdor, http://www.mag.gob.sv/index.php?option=com_phocadownload&view=category&id=35&Itemid=229
62 EU Agricultural Economic Briefs. “Women in EU agriculture and rural areas: hard work, low profile”, Brief No. 7, June 2012.
63 FAOSTAT. Search done within "resources" and "population", using annual time series.
65 Ministry of Food and Agriculture of Ghana. Agriculture in Ghana. Facts and Figures 2010. Ministry of Agriculture, Livestock and Fishery of Madagascar. Recensement de l' Agriculture. Campagne Agricole 2004-2005
66 FAO and National Institute of Statistics of Cambodia. National Gender Profile of Agricultural Households, 2010.
67 IFAD, Republic of the Congo. Country strategic opportunities programme, 2009 EB 2009/98/R.20.
68 FAO, Gender Team for Europe and Central Asia. “The crucial role of women in agriculture and rural development”
69 International Organization for Migration. "Rural women and migration"; B. Dodson et al. "Gender, migration and remittances in Southern Africa"; A. Datta and S.K. Mishra. “Glimpses of women's lives in rural Bihar: impact of male migration".
70 Cheryl Doss et al. "Gender inequalities in ownership and control of land in Africa. Myths versus reality"
72 On this, see for example the discussion by Celestine Nyamu-Musembi in "Breathing Life into Dead. Theories about Property Rights: de Soto and Land Relations in Rural Africa", Institute of Development Studies. 2006
73 The land distribution dataset compiled by GRAIN can be downloaded here.
74 See FAOSTAT glossary at http://faostat.fao.org/site/379/DesktopDefault.aspx?PageID=379
'곳간 > 해외자료' 카테고리의 다른 글
| 저럼한 해결책이 유전자변형 작물보다 여전히 뛰어나다 (0) | 2014.06.04 |
|---|---|
| 소농에겐 별 이득 없는 유전자변형 작물 (0) | 2014.06.04 |
| 유기농은 좋다, 하지만 예수는 아니다 (0) | 2014.05.31 |
| 소농은 대부분의 연구, 개발에서 제외되어 있다 (0) | 2014.05.31 |
| 커피 가격이 오르고 있다 (0) | 2014.05.31 |


