728x90

Soybeans harvested with a combine in Walnut, Illinois. U.S. farmers increased the harvesting of soybeans at the fastest pace in at least three decades as warm, dry weather allowed for fieldwork after a drought this year reduced yields.


Food prices that doubled in the past 10 years are more the result of population growth and increased demand for protein-based diets than any cyclical reasons, according to Sunny Verghese, chief executive officer at Olam International Ltd. (OLAM), the Singapore-based commodities trader.

Three of the biggest annual gains in food prices in the past 20 years occurred since 2007, with the United Nations Food & Agriculture Organization’s global food price index climbing to a record in 2010. Wheat and soybeans led commodities gains last year and corn jumped to a record in August.

“We’ve had a long period of food real price declines and food surpluses and we’ve had three very rapid food crises,” Verghese said at the Kingsman sugar conference in Dubai yesterday. “The price inflation that we’ve seen in the three episodes is more a structural story and not a cyclical issue.”

The United Nations’ Food & Agiculture Organization has said global food output must rise 70 percent by 2050 to feed a world population expected to grow to 9 billion from 7 billion now and as increasingly wealthy consumers in developing economies eat more meat. Agriculture has “good demand growth,” Chris Mahoney, director of agricultural products at Baar, Switzerland- based trader Glencore International Plc (GLEN), said at the conference yesterday.

“In just seven years, the world will need not only to produce, but to move 20 percent more food and also store it, transport it and process it,” Mahoney said. “Without the transport, logistics infrastructure and processing capacity, production even if it keeps pace with demand will be unable to reach the consumer.”

Global Demand

Global oilseed demand is growing at about 3 percent a year, while corn consumption is rising a “little less,” according to Mahoney. Wheat, rice and sugar demand worldwide are expanding at or just below 2 percent a year, he said.

“What concerns people, and perhaps it should, is that the demand side of the equation is clear and it’s predictable, but this demand growth will largely need to be met by yield gain, not by additional planted area and the true potential for yield gain is perhaps known by only a few,” Mahoney said.

High food costs contributed to civil unrest across the Middle East and North Africa in 2011, toppling governments in Tunisia and Egypt. The U.S. State Department estimates that surging food prices triggered more than 60 riots worldwide from 2007 to 2009. In India, about 60 percent of what people spend is on food, compared with 70 percent to 80 percent in Africa, 45 percent inChina, 9 percent in Europe and about 10 percent in the U.S., according to Olam’s Verghese.

‘Serious Problem’

“When you have 50-percent price inflation in the core commodities and 70 percent of your consumption basket is spent on food, then you have a serious problem,” Verghese said.

High food prices are needed to send farmers a signal to increase plantings, Verghese said. Countries from India and Egypt to Vietnam and Indonesia banned exports of rice, a staple for half the world, during the 2008 food crisis. Russia in 2010 banned cereal exports after the country’s worst drought in at least half a century destroyed crops and cut production.

“Price controls are precisely the wrong thing to do when you want to induce a supply response,” Verghese said. “You are distorting the price signal to the farmer to try to increase its production.”

Producing ethanol and biodiesel from food crops is “questionable,” Mahoney said. As many as 150 million tons of grains globally are used to produce ethanol, he said. Making ethanol from corn is inappropriate, Vergehese said.


728x90
728x90


1914년부터 1933년도까지의 쌀생산과 관련한 당시 일본인의 논문이 있어 그 논문에서의 그 자료를 가져왔습니다.

년도

쌀생산량

(만석)

단보당

생산량(석)

일본반출량

(만석)

반출율

조선내

쌀소비량(만석)

1인당 연간 쌀소비량(석)

일본

조선

1914

1,413

0.952

114

8%

1,299

0.98

0.69

1915

1,285

0.858

221

17%

1,064

1.11

0.72

1916

1,393

0.917

126

9%

1,268

1.08

0.68

1917

1,369

0.895

113

8%

1,256

1.13

0.73

1918

1,529

0.988

206

13%

1,323

1.14

0.68

1919

1,271

0.826

280

22%

  991

1.13

0.73

1920

1,488

0.957

199

13%

1,290

1.12

0.62

1921

1,432

0.935

339

24%

1,094

1.15

0.66

1922

1,501

0.964

314

21%

1,188

1.10

0.65

1923

1,518

0.979

405

27%

1,112

1.16

0.63

1924

1,322

0.839

486

37%

  836

1.12

0.60

1925

1,477

0.932

475

32%

1,003

1.13

0.52

1926

1,530

0.964

578

38%

  953

1.13

0.53

1927

1,730

1.080

646

37%

1,084

1.10

0.52

1928

1,351

0.890

701

52%

  650

1.13

0.54

1929

1,370

0.840

578

42%

  792

1.10

0.45

1930

1,918

1.154

516

27%

1,402

1.08

0.45

1931

1,587

0.948

903

57%

  685

1.13

0.52

1932

1,635

0.995

748

46%

  887

1.01

0.41

1933

1,819

1.072

789

43%

1,031

1.10

0.41


자료에 의하면 친일반역사상의 헛소리에도 불구하고 단위면적당 쌀의 생산량은 거의 증가하지 않았습니다.


또한 왜놈들은 늘어나는 조선의 농민들을 더 노동집약적(!) 농사를 시켜

묵힌땅의 개간 등으로 쌀 농사가 가능한 논을 더 많이 확보했다고 합니다.

물론 조선인의 땅이 아니라 왜놈들의 땅으로 말입니다.

이렇게해서 더 늘어난 농지로 인하여 초기에 비해 좀 더 생산된 쌀을 모조리 일본으로 가져갑니다.

조선에서 생산된 쌀의 절반이나 왜놈들이 가져갑니다.


친일반역사상에서는 일본으로 쌀을 수출하여 농민들이 돈벌었다는데 헛소립니다.

일제식민지하에서 농사지어서 돈벌었다면 추운 만주땅에 농사지으러 떠나는 사람들은 바보였을까요?


이 시기를 지나면서 조선인 자작농의 숫자는 줄어들고 소장농은 늘어만 갑니다.

일하는 농민의 숫자는 늘어나는데 조선내 쌀 소비량을 보면 조선인들이 1년간 소비하는 쌀의 총량은 더 줄어듭니다.

마찬가지로 1인당 연간 쌀소비량의 급격히 감소 합니다.


biin님이 식민지 조선에서는 쌀이 넘쳐났다고 주장하셨음에도 불구하고

일부 친일반역자들을 제외하고는 굶주릴 수 밖에 없었고

갈수록 소작쟁의가 늘어나는 이유가 통계자료로 보여주고 있는 것입니다.


위 통계에서 빠진부분이 있는데 그것은 일제 강점 초기에는 관의 눈을 피해 살아가는

소규모 자작농들의 수확과 소비가 빠져있습니다.

이때 빠진 통계는 나중에 거의 대부분 포함하게됩니다.

실제로는 변화가 없어도 통계상으로는 변화가 있는 것처럼 보이는 것입니다.


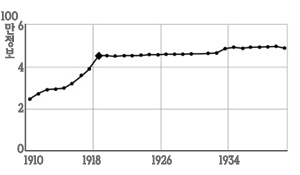
다음 그래프는 일제시대 경지면적의 증가에 관한 것입니다.

총독부의 통계연보에 나오는 수치에 의한 경지면적입니다.

이미지를 클릭하면 원본을 보실 수 있습니다.

1910년부터 1918년까지는 경사도가 급합니다. 경지면적이 82%가 증가되었다고 합니다.

하지만 그 이후에는 아주 완만한 증가세를 가지고 있습니다.


당시 불도저로 산을 깍아서 논밭을 만든 것도 아닌데 어떻게 이렇게 급작스레 늘었을까요?

1918년은 조선총독부의 토지조사사업이 완료되는 해 입니다.


친일반역사상가들은 이것을 토대로 일본의 도움으로 토지가 이만큼 늘었다고 개소리를 합니다.

인구증가에서도 마찬가지 설명이 있겠지만 일제강점기의 초기에는 왜놈들이 조선의 구석구석을 세밀하게 장악하지 못하였습니다. 그래서 토지나 인구에 있어서 누락분이 많았던 것입니다.


통계에 잡히지 않았던 것이 뒤늦게 토지대장에 등록되면서 통계수치만 늘어난 것입니다.

엉터리 통계로 경지면적을 일본이 늘려줬으니 고마워하라고 헛소리를 해서는 안되는 것입니다.


며칠전 신문에 우리나라에 토지대장에 등록되지 않은 주인없는 섬 1419개가  토지대장에 등록시킨다고 합니다. 이중에는 6만평이나 되는 섬도 있다고 하더군요. 이 섬들을 등록하면 없는 땅이 저절로 생기는 것이 되나요?


다음으로 일제 강점기 기간동안 조선의 인구가 2배나 늘었다는 거짓주장을 박박합니다.


조선시대에는 근대적인 인구조사가 없었습니다.

호패제도가 있었기는 하지만 이는 군역 등 을 위한 것이지 인구통계 등이 목적일 수 없었고

관을 피해 살아가는 하층민들은 대량으로 누락될 수 밖에 없었기에 정확성을 믿기가 힘이듭니다.


일제는 조선을 점령한 후 년말상주인구를 매년추계치로 작성하였습니다.

변동사항을 바탕으로 조사하는 것이며, 조선총독부가 초기에는 전국적인 수준에서의

행정장악력이 부족하였기에 누락된 인구가 많을 수 밖에 없다는 것을 인정해야 합니다.

1925년에 이러러 근대적인 인구조사인 조선국세(國勢)조사를 하기시작하면서 정확성을 갖추게 됩니다.


년말상주인구

(추계치)

5년간 증가율

국세조사

1910

13,128

 - 


1915

15,957

22%


1920

16,916

6%


1925

18,543

10%

19,020

1930

19,685

6%

20,438

1935

21,248

8%

22,208

1940

22,954

8%

23,547

단위 천명


표에서와 같이 2925년이 되어 일제가 조선을 강점한지 15년이 지난뒤에도 
두가지 인구조사는 5%에 가까운 오차를 보여주고 있습니다.

또한 1910년에서 1915년까지 5년 사이에 무려 22%라는 엄청난 인구 증가를 보여주고 있습니다.

이것은 실제 인구가 5년사이에 22%가 증가한 것이라고 생각하는 것은 멍청한 짓입니다.


일제강점 초기에 전국의 방방곡곡을 세밀하게 장악하지못한 일본인들이 초기에 잘못된 인구총계를 만들었고 5년뒤에는 1010년의 기록에서 빠진 인원중 상당수가 포함되었다는 것을 의미합니다.


일부 친일반역사상을 선동하는 자들은 일제강점 초기의 부실한 data를 이용하여

일제강점기에 조선의 인구가 2배나 늘었으니 일본에게 감사하라는 개소리를 합니다.


초기 data가 부정확하다는 것을 알고있는 일본과 한국의 학자들의 일제강점 초기의 인구를 여러가지 자료를 바탕으로 다음과 같이 추정하고 있습니다.

년도

석남국

김철

권태환

(신용하)

국세조사

1900


17,082


1905


1906


14,733


1910

15,474

16,309

17,427


1915

16,484

17,027

17,656


1920

17,532

17,629

18,072


1925

18,797

19,020

19,020

19,020

1930

20,218

20,438

20,438

20,438

1935

21,890

22,208

22,208

22,208

1940

23,341

23,547

23,547

23,547

1944

24,917

25,120

25,120


인구증가

61%

54%

44%


단위 천명, 2001년 길인성의 논문에서 재인용 함.

석남국 : 1966년 일본 논문

김철 : 1965년 일본 논문

권태환, 신용하 : 1977년


일제하의 가장 믿을 수 있는 인구조사인 국세조사와 함께 검토해봤을때 
석남국의 주장은 사실과 가장 많이 떨어진 것입니다.


김철의 주장은 일제 강점기 기간동안 54%의 인구증가가 있었고

권태환의 주장에는 44%의 인구증가가 있다고 추정하였습니다.

요즘은 학계에서 여러가지 다른 방법으로 인구변화를 추정하고 있습니다만

가장 권위를 인정해주는 것은 권태환과 신용하(유명하신분이죠)의 추정치입니다.


이미 오래전에 식민지시기의 인구증가가 2배라는 것은 엉터리라는 것이 밝혀졌음에도 불구하고

친일반역선동가들은 일본제국주의의 조선 강점을 찬양하기위해 엉터리 수치를 내세우는 것입니다.


http://m.blog.daum.net/_blog/_m/articleView.do?blogid=02UG8&articleno=11827030

728x90
728x90


728x90

+ Recent posts